

Mid-Year Marketing Checkpoint: What to Actually Measure Before Planning H2

Six months in, most SMBs have spent half their annual marketing budget. Very few can tell you exactly what it returned.
That’s not a lack of effort — it’s a lack of structure. When you’re running a small business, marketing tends to happen reactively: a social post when someone has time, a boosted ad when a campaign feels stale, an email when the silence has gone on too long. By July, you have activity. What you may not have is data you can act on.
The mid-year marketing checkpoint is the decision point that separates SMBs who compound their learning year over year from those who reset from scratch every January. Before you commit your H2 budget to the same mix that carried H1, there are five metrics you need to measure — and three clear decisions you need to make from what you find.
A mid-year marketing review means checking five core metrics: cost per lead by channel, attribution data, content-to-conversion rates, email list health, and organic traffic quality. Sort every active channel into one of three buckets — keep, cut, or test. This process turns your H2 plan into an evidence-based decision, not a rerun of H1.
Why the Mid-Year Review Matters More in 2026
The rhythm of marketing has compressed. Google’s core updates now roll quarterly. AI Overviews are reshaping which traffic actually reaches your site. Organic social reach continues to narrow on most platforms. If your H1 strategy was built on assumptions from late 2025, some of those assumptions have already shifted.
There’s also a budget reality: most SMBs front-load their marketing spend. The first half of the year typically carries higher investment — a seasonal campaign, a website refresh, a new content push. The second half needs to be smarter, not just more of the same. That only happens if you know what the first half produced.
The mid-year review isn’t about criticism. It’s about intelligence. SMBs that use it well don’t just optimise H2 — they build a feedback loop that makes each subsequent half-year sharper than the last.
The 5 Metrics That Tell You Whether H1 Actually Worked
Before you open a spreadsheet, know what you’re looking for. Each metric below answers a specific question about your marketing performance. Together, they give you a complete picture of what’s worth keeping.
1. Cost Per Lead by Channel
Most SMBs track lead volume. The metric that actually drives decisions is cost per lead — broken down by channel.
Here’s why volume misleads: if Google Ads generated 40 leads in H1 and your email newsletter generated 12, the instinct is to protect the Ads budget. But if those 40 leads cost £80 each and the 12 cost £6 each (amortised across production time), the email channel is delivering more than six times the efficiency at a fraction of the volume.
Calculate it now: total H1 spend per channel (including your time at a real hourly rate) ÷ leads attributed to that channel = cost per lead. Flag any channel where cost per lead has crept above your average deal value. That’s your H2 cut list.
[PLACEHOLDER: insert Tabula client example here once case data is available — e.g., ‘an SMB client we audited in Q2 found their LinkedIn ads were generating leads at 4× the cost of their organic search traffic, a gap invisible in their activity reports.’]
2. Channel Attribution
Attribution is where most SMB marketing reviews break down. Without clear attribution data, you’re distributing H2 budget based on gut feeling rather than performance evidence.
The minimum viable version: check whether your CRM or contact form includes a ‘How did you hear about us?’ field. If it doesn’t, add one now — it will be your single highest-value data collection change for H2. Cross-reference those responses against Google Analytics channel data for the same period. The goal is understanding where buyers actually came from, not just where traffic came from.
Pay particular attention to the gap between first-touch and last-touch attribution. A buyer might discover you through a blog post, follow your LinkedIn for three months, and then convert via a direct visit. Attributing that sale to ‘direct’ undervalues the content that started the relationship — and leads to the wrong H2 decision about where to invest.
3. Content-to-Conversion Rate
Traffic without conversion tells you your content attracts readers. It doesn’t tell you whether it attracts buyers.
For each piece of content published in H1, pull two numbers: unique visits and conversion events (a form submission, a CTA click, a contact enquiry). Divide conversions by visits. Anything below 0.5% on a decision-stage page is worth examining. Anything above 2% on any page is a template worth replicating in H2.
This metric also reveals a common structural problem: high-traffic posts that never convert. These are usually informational awareness posts sitting on pages with no clear next step. They’re not failures — they’re conversion architecture problems. The fix is adding a relevant CTA, not replacing the content.
4. Email List Health
Email is one of the most durable marketing channels available to SMBs, but list decay is real and faster than most owners expect. A list that opened at 35% in January will degrade measurably over 12 months without active maintenance.
The metrics to check at mid-year: open rate trend (the direction over 6 months, not a single month snapshot), click-to-open rate (CTOR), unsubscribe velocity, and hard bounce rate. A declining CTOR with a stable open rate is a specific signal: your subject lines are working but your content isn’t delivering on the promise. That’s a fixable problem in H2.
If your list hasn’t had a re-engagement campaign in the past 12 months, add one to the H2 calendar before sending another promotional email. Sending repeatedly to a disengaged list trains inbox providers to filter you — an effect that compounds negatively over time.
5. Organic Traffic Quality
Traffic volume is a vanity metric. Traffic quality — measured by engagement rate, pages per session, and conversion behaviour from organic visits — determines whether your SEO investment is compounding.
Pull your top 10 organic landing pages for H1. For each one, check average engagement time, bounce rate, and whether there’s a clear conversion path from that page. If a post has high impressions in Google Search Console but near-zero click-through, it may be ranking for queries where AI Overviews are answering the question before the user clicks through. That’s a content strategy signal, not an SEO failure: it means the content needs to go deeper than what an overview would cover.
Understanding why your organic traffic may not be converting is often the first step toward fixing it — and it starts with separating traffic volume from traffic intent.
The 3-Bucket Sort: Keep, Cut, or Test
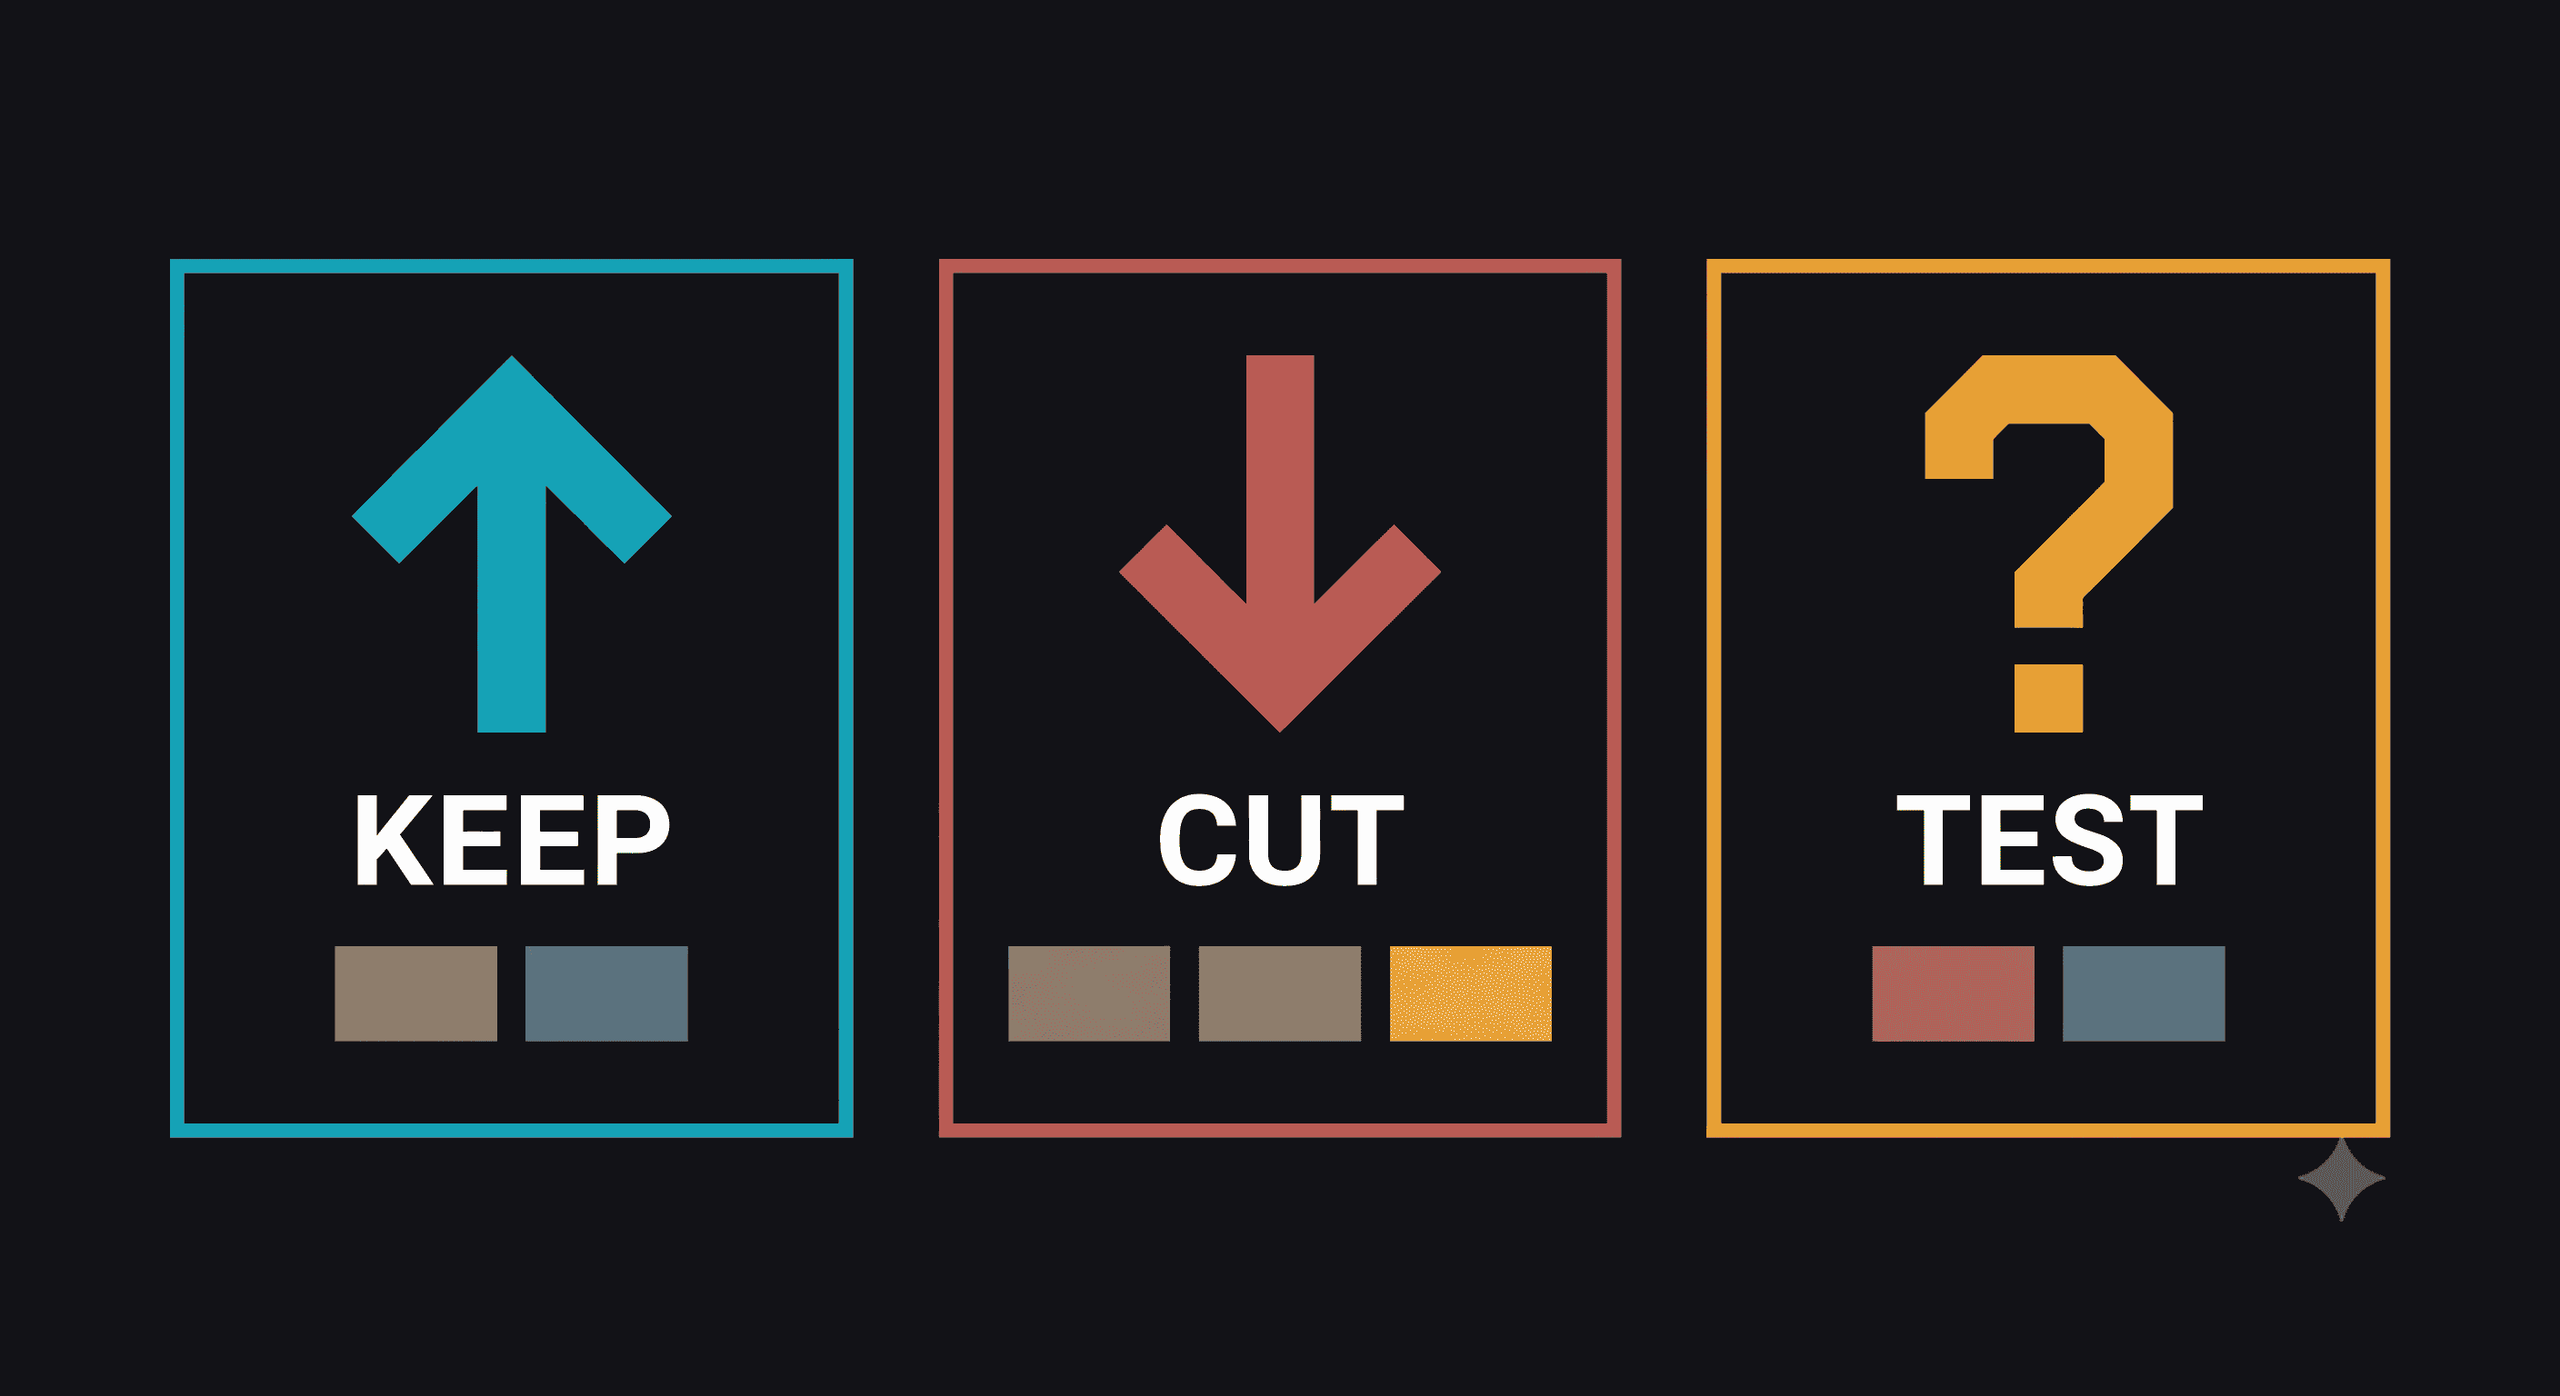
Once you have the data, you need a decision framework — not an opinion loop. Every channel and tactic from H1 goes into one of three buckets.
Keep: This channel consistently generates leads at or below your target cost per lead, has a positive attribution signal, and scales predictably with investment. Don’t optimise it to death. Protect it, document it, and build on it in H2.
Cut: This channel or tactic has absorbed budget or time in H1 with no clear lead attribution, declining engagement, or a cost per lead above your deal value. Cutting isn’t failure — it’s how you free capacity and budget for what works. The challenge is emotional: channels you’ve invested in feel harder to abandon. Make the decision on numbers, not sunk cost.
Test: Tactics that showed early signal in H1 but didn’t have enough data to evaluate properly. These get a structured 90-day test in H2: defined budget, defined success metric, defined review date. If they don’t meet the threshold by the review date, they move to Cut.
The bucket sort should take less than 90 minutes with the data from the five metrics above. If it’s taking longer, the bottleneck is usually missing attribution data — which is itself a signal about the most important infrastructure fix for H2.
How to Set H2 Targets Grounded in Evidence
Most SMB marketing targets are set by aspiration: ‘We want to double our leads in H2.’ That’s a wish, not a plan.
Evidence-based targets start with what H1 actually produced, apply realistic efficiency gains based on the channels in your Keep bucket, and account for what you’re cutting and testing. An SMB that generated 60 leads in H1 through channels with 15–20% efficiency improvements available isn’t projecting 120 leads in H2 — a realistic model gets you to 70–75, with a documented path to each one.
Two numbers to establish before finalising H2 targets: your marketing-qualified lead (MQL) threshold — the minimum engagement a lead needs to demonstrate before it moves to sales — and your current MQL-to-close rate from H1 data. These two figures anchor every channel-level target you set for the second half of the year.
What the Review Is Really Telling You
The mid-year metrics review surfaces something more fundamental than channel performance. It reveals whether your marketing is running as a system or as a collection of disconnected tactics.
When every channel can be traced to a lead, results are consistent, and the handover from marketing to sales is documented — that’s a system. When outcomes depend on whoever had bandwidth that week, attribution is fuzzy, and the same campaigns run by inertia rather than decision — those are tactics. Both can produce results in the short term. Only one scales.
If the review shows that three of your five marketing channels have unclear attribution, that’s not a measurement problem. It’s a structural one. The fix isn’t better reporting — it’s connecting activities into a coherent sequence: awareness content that links to specific conversion paths, lead capture that routes into your CRM automatically, follow-up that doesn’t depend on someone remembering to send an email. That structural shift is what the Tabula Build → Run → Train → Own model is designed to address.
If you’re already using AI-powered lead generation systems, the mid-year review is also the point at which you assess whether those tools are integrated or isolated — contributing to a system or adding to the noise.
And if you’ve recently taken your marketing back from an agency, the mid-year checkpoint is the first real test of whether your in-house capability matches the ambition of the strategy you inherited.
Frequently Asked Questions
What is a mid-year marketing review?
A mid-year marketing review is a structured assessment of H1 marketing performance, typically run in late June or early July. It examines which channels produced qualified leads, what each channel cost relative to what it returned, and what changes to make before committing to an H2 plan. The output should be a concrete decision — not just a summary of what happened.
What marketing metrics should I track for my mid-year review?
The five most actionable metrics for an SMB mid-year review are: cost per lead by channel, channel attribution (how buyers actually found you), content-to-conversion rate, email list health as a trend rather than a snapshot, and organic traffic quality by engagement and conversion behaviour.
How long does a mid-year marketing review take for a small business?
For most SMBs, a structured review takes three to four hours: roughly one hour to pull and collate data from your analytics tools and CRM, 90 minutes for the bucket sort and decision-making, and one hour to document the H2 plan and brief whoever executes it. The most common bottleneck is missing attribution data — the review surfaces this gap clearly.
What’s the difference between a marketing audit and a mid-year review?
A full marketing audit examines your entire marketing infrastructure — technical SEO, website structure, brand positioning, and competitive landscape. A mid-year review is narrower and action-oriented: its output is a concrete H2 plan, not a strategic overhaul. Use the mid-year review for operational recalibration. Commission a full audit when building or rebuilding a marketing system from scratch.
Should I change my entire H2 strategy if H1 underperformed?
Not necessarily. H1 underperformance can reflect a channel mix problem, an attribution problem, or a conversion architecture problem — none of which require replacing your entire strategy. Identify which of the three you’re dealing with before making changes. Scrapping everything and starting over is the most expensive response to unclear data, and typically the least effective one.
The Checkpoint That Changes How You Plan
The mid-year review is the most underused planning tool in SMB marketing. It turns six months of activity into six months of evidence — and evidence is the only reliable input for a strategy that compounds.
The SMBs that use it well don’t wait until Q4 to ask why things didn’t work. They use July to make sure Q4 has fewer questions and more answers.
If you want to understand what your H1 data is actually telling you — and what structural changes would make H2 perform differently — book a free marketing audit with Tabula. We’ll walk through your current setup, identify the gaps, and show you what a system built to scale looks like.
You can also start automating the parts of your marketing that are eating your time before H2 gets underway.

Author
Carlos Rios
Carlos Rios is the Founder of Tabula. Before starting the agency, he spent his career inside companies — reporting to leaders who had no patience for vanity metrics and wanted straight answers about what was working and why. He built Tabula around that same standard: a marketing system the client owns, powered by AI and led by experts who explain the plan in plain language. Carlos studied philosophy for six years at York University and holds a Master's in Marketing from the Schulich School of Business.