
What Is a Good ROAS? Benchmarks, and What Actually Moves It

You are looking at a 3.4x ROAS and you cannot tell whether to celebrate or panic. Your agency calls it strong. A blog post you read this morning said 4x is the minimum. Someone on Reddit said they scale profitably at 1.8x. All three claims can be true at the same time, which is exactly why “what is a good ROAS” so rarely gets a useful answer.
Here is what the benchmark articles leave out. The longest-running benchmark study in paid search does not publish a ROAS figure at all. WordStream by LocaliQ’s 2026 Search Advertising Benchmarks, now in its tenth edition, reports click-through rate, cost per click, conversion rate and cost per lead across more than 20 industries. It reports no ROAS, because ROAS requires revenue data that advertisers do not hand over. Every “average ROAS by industry” table you have seen is an estimate stacked on other estimates.
So this post does two things. It gives you the benchmark ranges that genuinely exist, with their sources and their limits. Then it gives you the three numbers that actually decide whether your return is good: your floor, your target, and your ceiling.
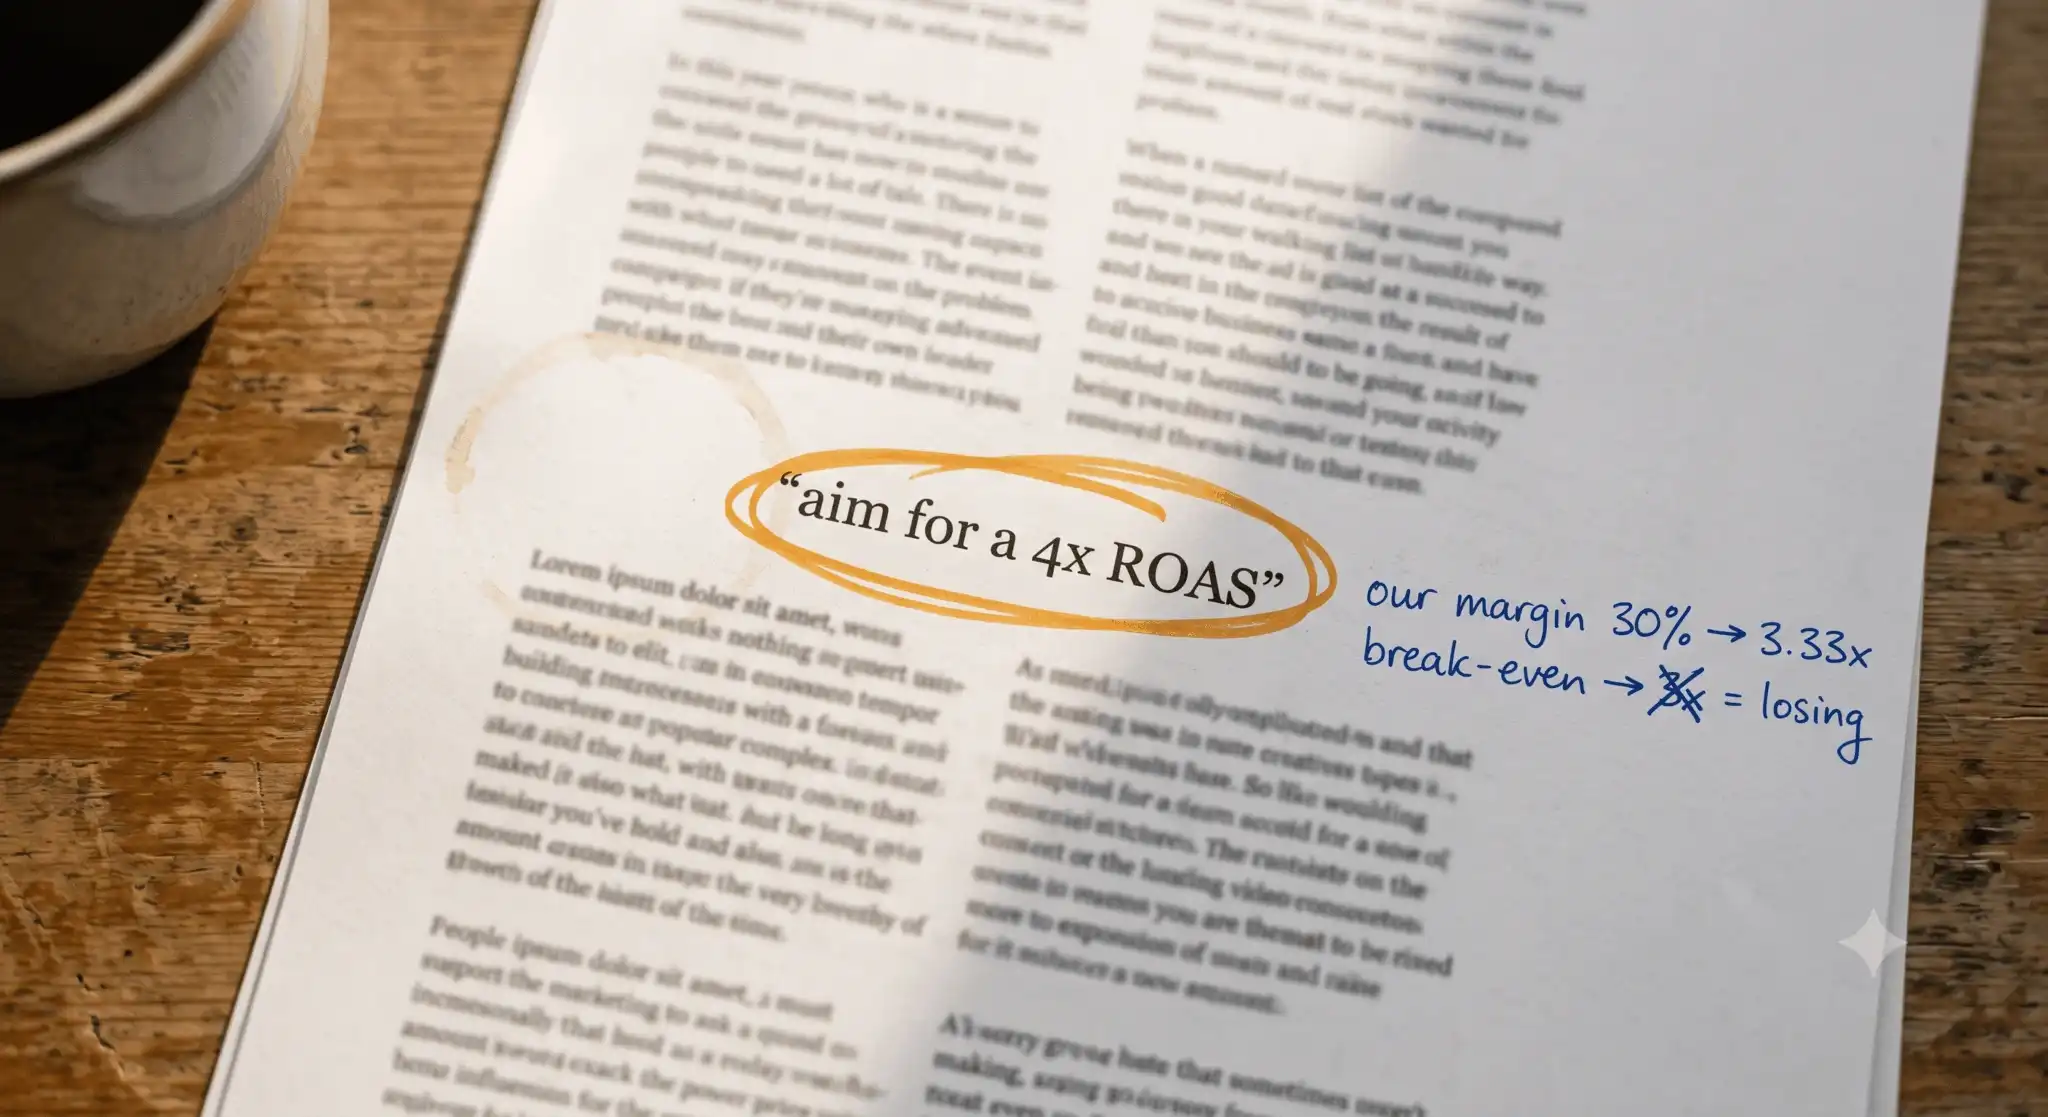
A good ROAS is any return above your break-even point, which equals 1 divided by your gross margin. At a 40% margin, break-even is 2.5x. Published cross-industry averages sit between roughly 2.3x and 5.3x depending on the source, and none of them know your margin. Find your floor first, set your target above it, then cap it at your trailing actual ROAS.
What is a good ROAS?
A good ROAS is any return on ad spend that clears your break-even point and funds your profit goal. Break-even equals 1 divided by your gross margin. At a 50% margin you break even at 2x. At a 25% margin you need 4x just to stand still. The industry average is irrelevant if your margin differs from the average.
This is why two businesses can report an identical 3x ROAS and reach opposite conclusions. A software company at an 85% gross margin keeps most of that revenue as contribution. A retailer at a 22% gross margin is losing money at 3x before it has paid for warehousing, returns or payment processing. The dashboard figure is the same. The outcome is not.
Which means the first thing to fix is the arithmetic, not the bid strategy.
How do you calculate ROAS?
ROAS is revenue attributed to ads divided by ad spend. Spend $10,000, generate $34,000 in tracked revenue, and your ROAS is 3.4x or 340%. Google Ads reports the same figure in the Conv. value / cost column, which returns a decimal rather than a percentage.
That decimal-versus-percentage split causes a specific and expensive error. Your account reports actual performance as 3.4, but the Target ROAS field expects 340%. Enter 3.4 into the target field and you have told Google you will accept roughly three cents of revenue for every dollar spent, and the strategy will spend accordingly.
Three inputs decide whether the resulting number means anything: which conversions carry a value, what value they carry, and how long the attribution window runs. Change any one of the three and the same campaign reports a different ROAS. That is worth holding onto, because it explains most disagreements about whether a campaign is working.
What are the published ROAS benchmarks, and how far apart are they?
Published cross-industry ROAS averages for paid search in 2026 range from roughly 2.3x to 5.3x. That spread is not measurement noise. It reflects different datasets, different attribution settings, and in several cases the aggregation of other people’s aggregates.
| Source | Reported ROAS figure | What it is based on |
|---|---|---|
| Google Ads Help, Target ROAS documentation | 500% used as a worked example | Illustrative only. Google publishes no benchmark. |
| WebFX paid search analysis (published 2026) | 2.26x across industries | 2025 paid search campaign data |
| WordStream by LocaliQ, 2026 Search Advertising Benchmarks | None published | Thousands of Google Ads and Microsoft Ads campaigns, April 2025 to March 2026, 20+ industries |
| Assorted 2026 benchmark blogs | 2.87x, 3.5x, 3.52x, 4.2x, 5.3x | Largely recycled from the two rows above |
The most useful row in that table is the empty one. WordStream by LocaliQ analysed thousands of campaigns across more than 20 industries for the tenth consecutive year and published click-through rate, cost per click, conversion rate and cost per lead. It did not publish ROAS. Search Engine Journal, covering the report, made the underlying point plainly: benchmarks were never meant to function as universal goals.
Use benchmarks for one job. They tell you whether your cost per click and conversion rate are roughly normal for your vertical. They cannot tell you whether your return is profitable, because they do not contain your margin.
The Tabula Three-Number ROAS Model
Rather than one benchmark, work with three numbers: a floor you must clear, a target that funds your profit goal, and a ceiling you should not exceed when setting a bid target. Together they replace the industry average with arithmetic specific to your business.
Number one, your floor (break-even ROAS)
Break-even ROAS equals 1 divided by your gross margin. At a 40% gross margin your floor is 2.5x. Below it, every additional dollar of ad spend costs you money before overheads are counted. Use gross margin after cost of goods, shipping, payment processing and expected returns, not the margin on your price list.
| Gross margin | Break-even ROAS | What that means |
|---|---|---|
| 70% | 1.43x | High-margin services and software |
| 50% | 2.00x | Strong-margin products |
| 40% | 2.50x | Typical healthy ecommerce |
| 30% | 3.33x | Mid-margin retail |
| 25% | 4.00x | Where the 4x rule of thumb comes from |
| 20% | 5.00x | Thin-margin retail |
| 15% | 6.67x | Paid acquisition is likely the wrong channel |
That table explains the 4x figure you keep reading. It is roughly right for a business at a 25% gross margin. For a services business at 60% it is a target that will strangle volume for no reason at all.
Number two, your target (profit ROAS)
Target ROAS equals 1 divided by your gross margin minus the contribution margin you intend to keep. Take a 40% gross margin and a goal of retaining 15% of ad-driven revenue as contribution. One divided by 0.25 gives a 4x target. Raise the profit goal and the target climbs steeply, which is the real constraint on scaling rather than budget availability.
Number three, your ceiling (trailing actual ROAS)
Your ceiling is the return your account has recently delivered, and Google’s own Target ROAS documentation is explicit that the target you set should sit at or below your historical performance. Find it in the Conv. value / cost column across four weeks or three conversion cycles, whichever is longer. Set a target above that ceiling and you restrict traffic rather than improve returns.
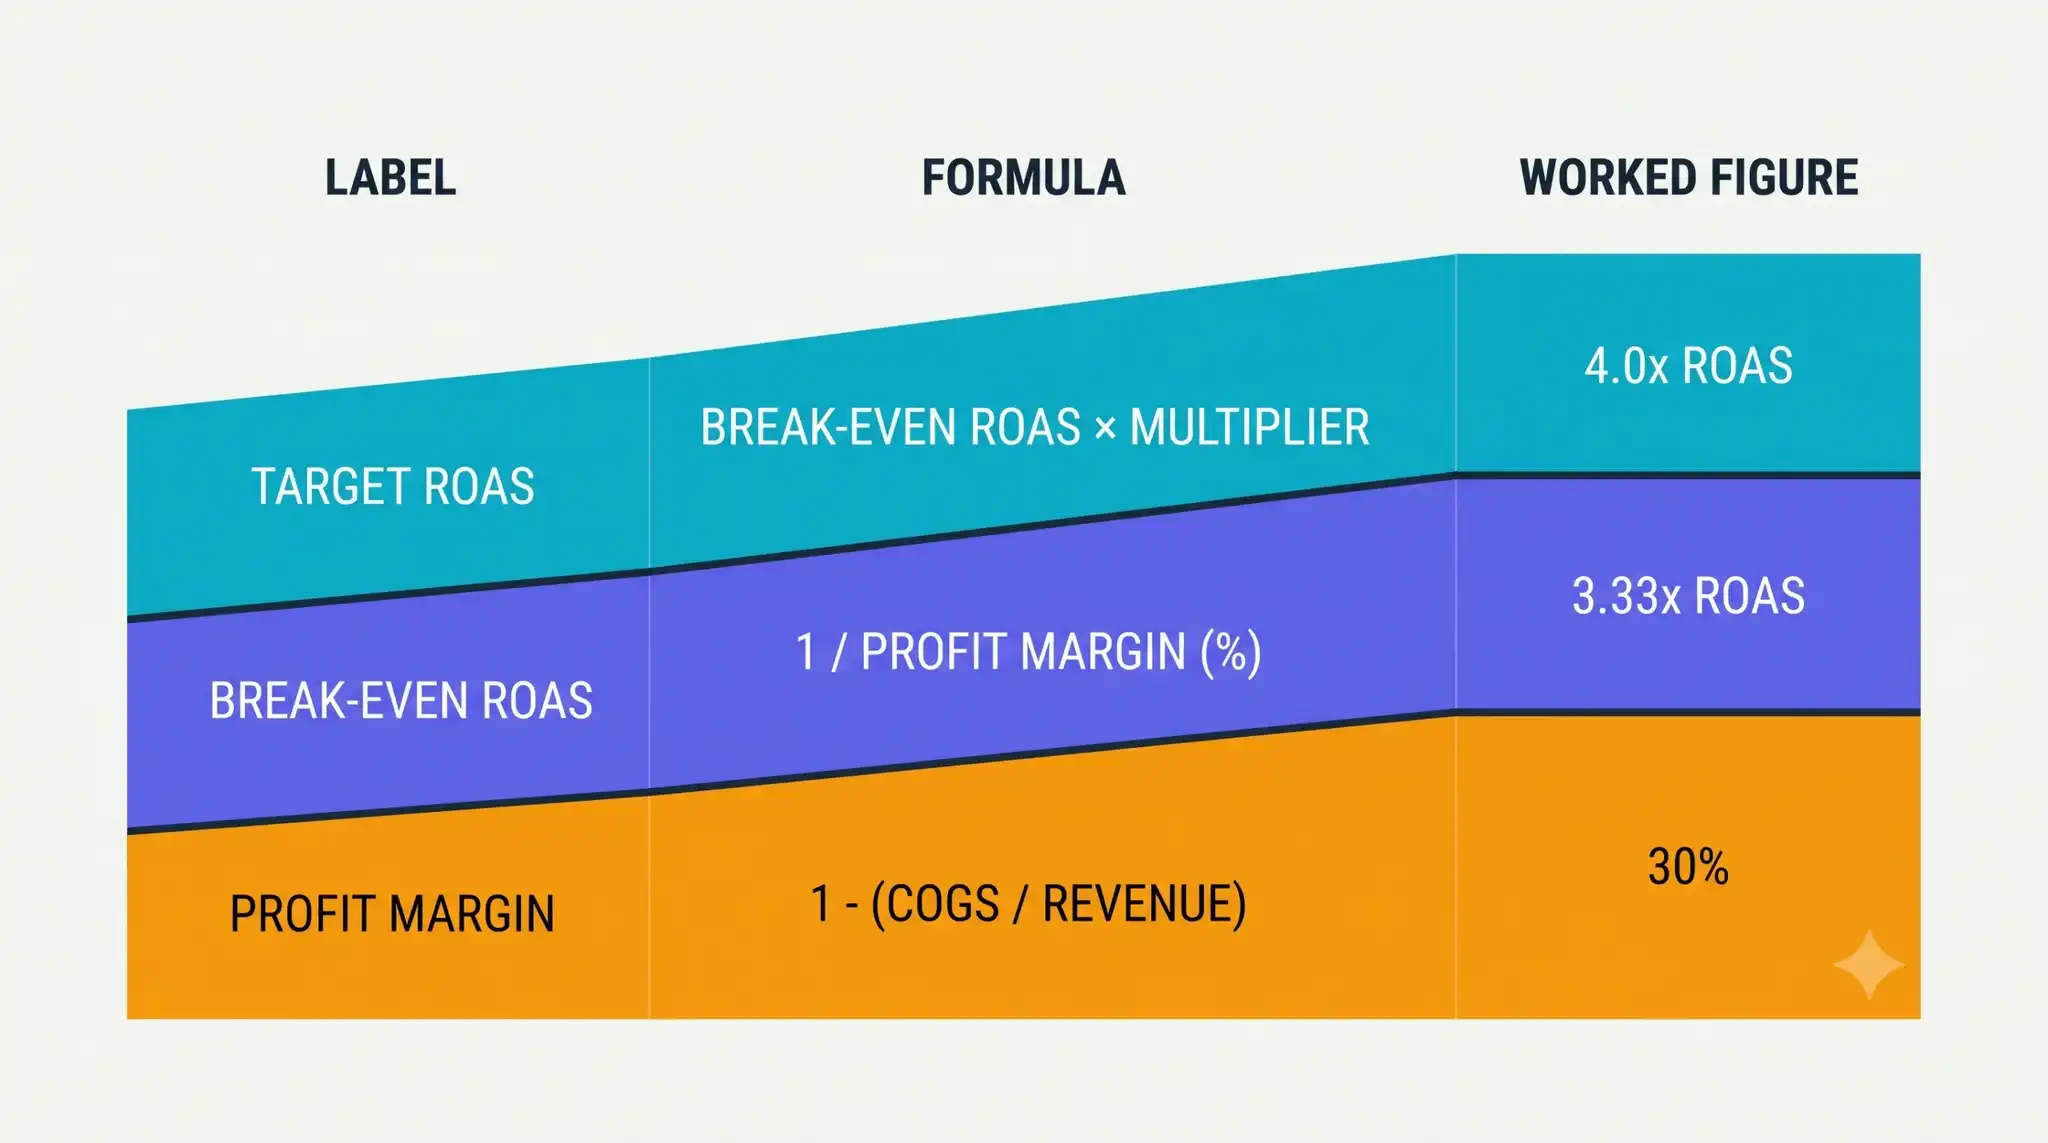
The order matters. Floor, then target, then ceiling. If your target sits above your ceiling, the gap is a conversion rate or margin problem, and no bid setting will close it.
Why does the same campaign show a different ROAS in every dashboard?
Because ROAS is an attribution output rather than a measurement. Platform ROAS counts revenue the platform believes it caused. Blended ROAS divides total revenue by total ad spend. Incremental ROAS counts only revenue that would not have arrived anyway. The three figures rarely agree, and the largest gap is usually on retargeting.
Retargeting flatters platform reporting because the audience was already close to buying. Attribution windows widen the gap further: a 7-day click window and a 30-day click window applied to identical activity produce different revenue totals, and therefore different ROAS, from the same campaign.
Reconcile once a month. Take total revenue, divide it by total ad spend across every paid channel, and compare that blended figure against the sum of what your platforms claim. If platform-reported revenue exceeds the revenue in your accounts, your dashboards are double-counting, and the ROAS you are optimising towards is fiction.
What actually moves ROAS?
Four inputs move ROAS: conversion rate, average order value, gross margin, and cost per click. Most advertisers pull only the fourth, which is the one they control least, because cost per click is set by an auction rather than by a setting.
Conversion rate is the strongest lever available. Lifting landing page conversion from 2% to 3% raises ROAS by 50% at identical spend, because the same cost is divided across half again as many sales. No bid adjustment reliably produces a result of that size.
Average order value is second, and it moves without touching the ad account at all. Bundles, minimum-order thresholds and post-purchase offers raise the revenue side of the equation. Gross margin is third: renegotiating cost of goods or reducing discount depth lowers your floor, which turns a previously unprofitable ROAS profitable without changing campaign performance by a single percentage point.
Cost per click comes last, and it is mostly a consequence of relevance rather than a lever. LocaliQ’s 2026 search advertising benchmarks put average paid search cost per click at $5.42 across industries, from $1.63 in arts and entertainment to $9.87 for attorneys and legal services. In a high-cost vertical the fix is rarely lower bids. It is a higher conversion rate, or a channel mix that leans harder on demand you do not have to buy.
That last point is where ROAS stops being a paid media question. If organic demand is softening, more of your pipeline has to be purchased, and your blended acquisition cost rises even when campaign performance is flat. It is worth understanding why website traffic is dropping before concluding that the ad account is the problem. Where the cheaper channel is simply underbuilt, a DIY SEO audit for a small business will usually surface more headroom than another round of bid adjustments.
When is a low ROAS the right answer?
A low ROAS is correct when the first purchase is not the point. Subscription, repeat-purchase and high-lifetime-value businesses can profitably run below break-even on acquisition, because the second and third orders carry no acquisition cost at all.
The test is straightforward. If your repeat rate and average lifetime value are measured rather than assumed, you can justify spending to a first-order ROAS below your floor. If they are assumed, you are not running a growth strategy, you are subsidising strangers.
A high ROAS deserves the same suspicion. An account returning 12x is usually harvesting demand that already existed, frequently on brand terms, and is almost certainly underspending. Rising ROAS alongside flat revenue means you shrank your way to a better ratio.
How should you set a ROAS target in Google Ads?
Set it at or below your trailing actual ROAS, and only once the account meets Google’s documented minimums. For Search and Shopping campaigns, Target ROAS requires at least 15 conversions in the past 30 days at the conversion tracking level. Demand Gen campaigns require 50 conversions in the past 35 days, at least 10 of them in the past 7.
Google also recommends reporting conversion values across the relevant campaigns for four weeks, or three conversion cycles, whichever is longer, before setting a target. Two further details catch people out. Once Target ROAS is live, existing bid adjustments are ignored, with the single exception of a device adjustment of -100%. And daily spend can reach twice your average daily budget, although the monthly total stays capped.
Then move in small steps. Lowering the target increases volume by letting the strategy enter more auctions. Raising it does the reverse. Allow one to two conversion cycles before reading a change as a trend rather than noise.
Common questions about ROAS
Is a 3x ROAS good?
A 3x ROAS is profitable above a 33% gross margin and unprofitable below it. At a 30% margin you break even at 3.33x, so 3x is a slow loss rather than a win. Check the margin before treating 3x as either a success or a failure.
What is a good ROAS for ecommerce?
Most ecommerce operations run gross margins between 30% and 45%, putting break-even between roughly 2.2x and 3.3x. That range is where the widely quoted 4x figure originates: it clears the floor for a mid-margin retailer with room left for profit. Verify against your own margin after returns and shipping.
What does ROAS mean in marketing?
ROAS stands for return on ad spend. It measures revenue generated per unit of advertising cost, expressed either as a multiple such as 3.4x or a percentage such as 340%. It measures advertising efficiency only, and ignores product cost, overheads and refunds entirely.
Is ROAS the same as ROI?
No. ROAS divides revenue by ad spend. ROI divides profit by total investment. A 4x ROAS can sit alongside a negative ROI once cost of goods, overheads and returns are counted, which is why some teams have moved to profit on ad spend instead.
The number that matters is yours
The reason “what is a good ROAS” has no consensus answer is that the question is missing a variable. Add your gross margin and it resolves immediately. Your floor is 1 divided by that margin. Your target is set by the profit you intend to keep. Your ceiling is what the account has already proved it can deliver. Everything else is somebody else’s average, calculated on somebody else’s cost of goods.
If your reporting cannot produce a reliable trailing ROAS, or your platforms are claiming more revenue than your accounts show, that is a measurement problem rather than a media problem, and a new bid strategy will not resolve it. Getting the numbers trustworthy comes first, and it is usually a shorter job than people expect. Talk through your measurement setup if you want a second pair of eyes on what your dashboards are actually telling you.
And if the answer turns out to be that too much of your pipeline is bought rather than earned, professional SEO services lower blended acquisition cost over a longer horizon than any bid adjustment can.
Work out your floor this week. It takes ten minutes and it changes every budget conversation you have after it.

Author
Carlos Rios
Carlos Rios is the Founder of Tabula. Before starting the agency, he spent his career inside companies — reporting to leaders who had no patience for vanity metrics and wanted straight answers about what was working and why. He built Tabula around that same standard: a marketing system the client owns, powered by AI and led by experts who explain the plan in plain language. Carlos studied philosophy for six years at York University and holds a Master's in Marketing from the Schulich School of Business.